Reports New in 2.6
A Report is a custom-built PDF document of your tracked data. You assemble it from graphs and saved searches, set a time range, and export it to share, print, or archive.
Use a report when you want to:
- Hand printed data to a doctor, coach, or therapist.
- Keep a periodic snapshot of how things are going.
- Share results with someone who doesn't use the app.
Opening Reports
- Tap the gear icon to open Settings.
- Tap Report in the Your Data section.
The report builder opens. It's empty the first time.
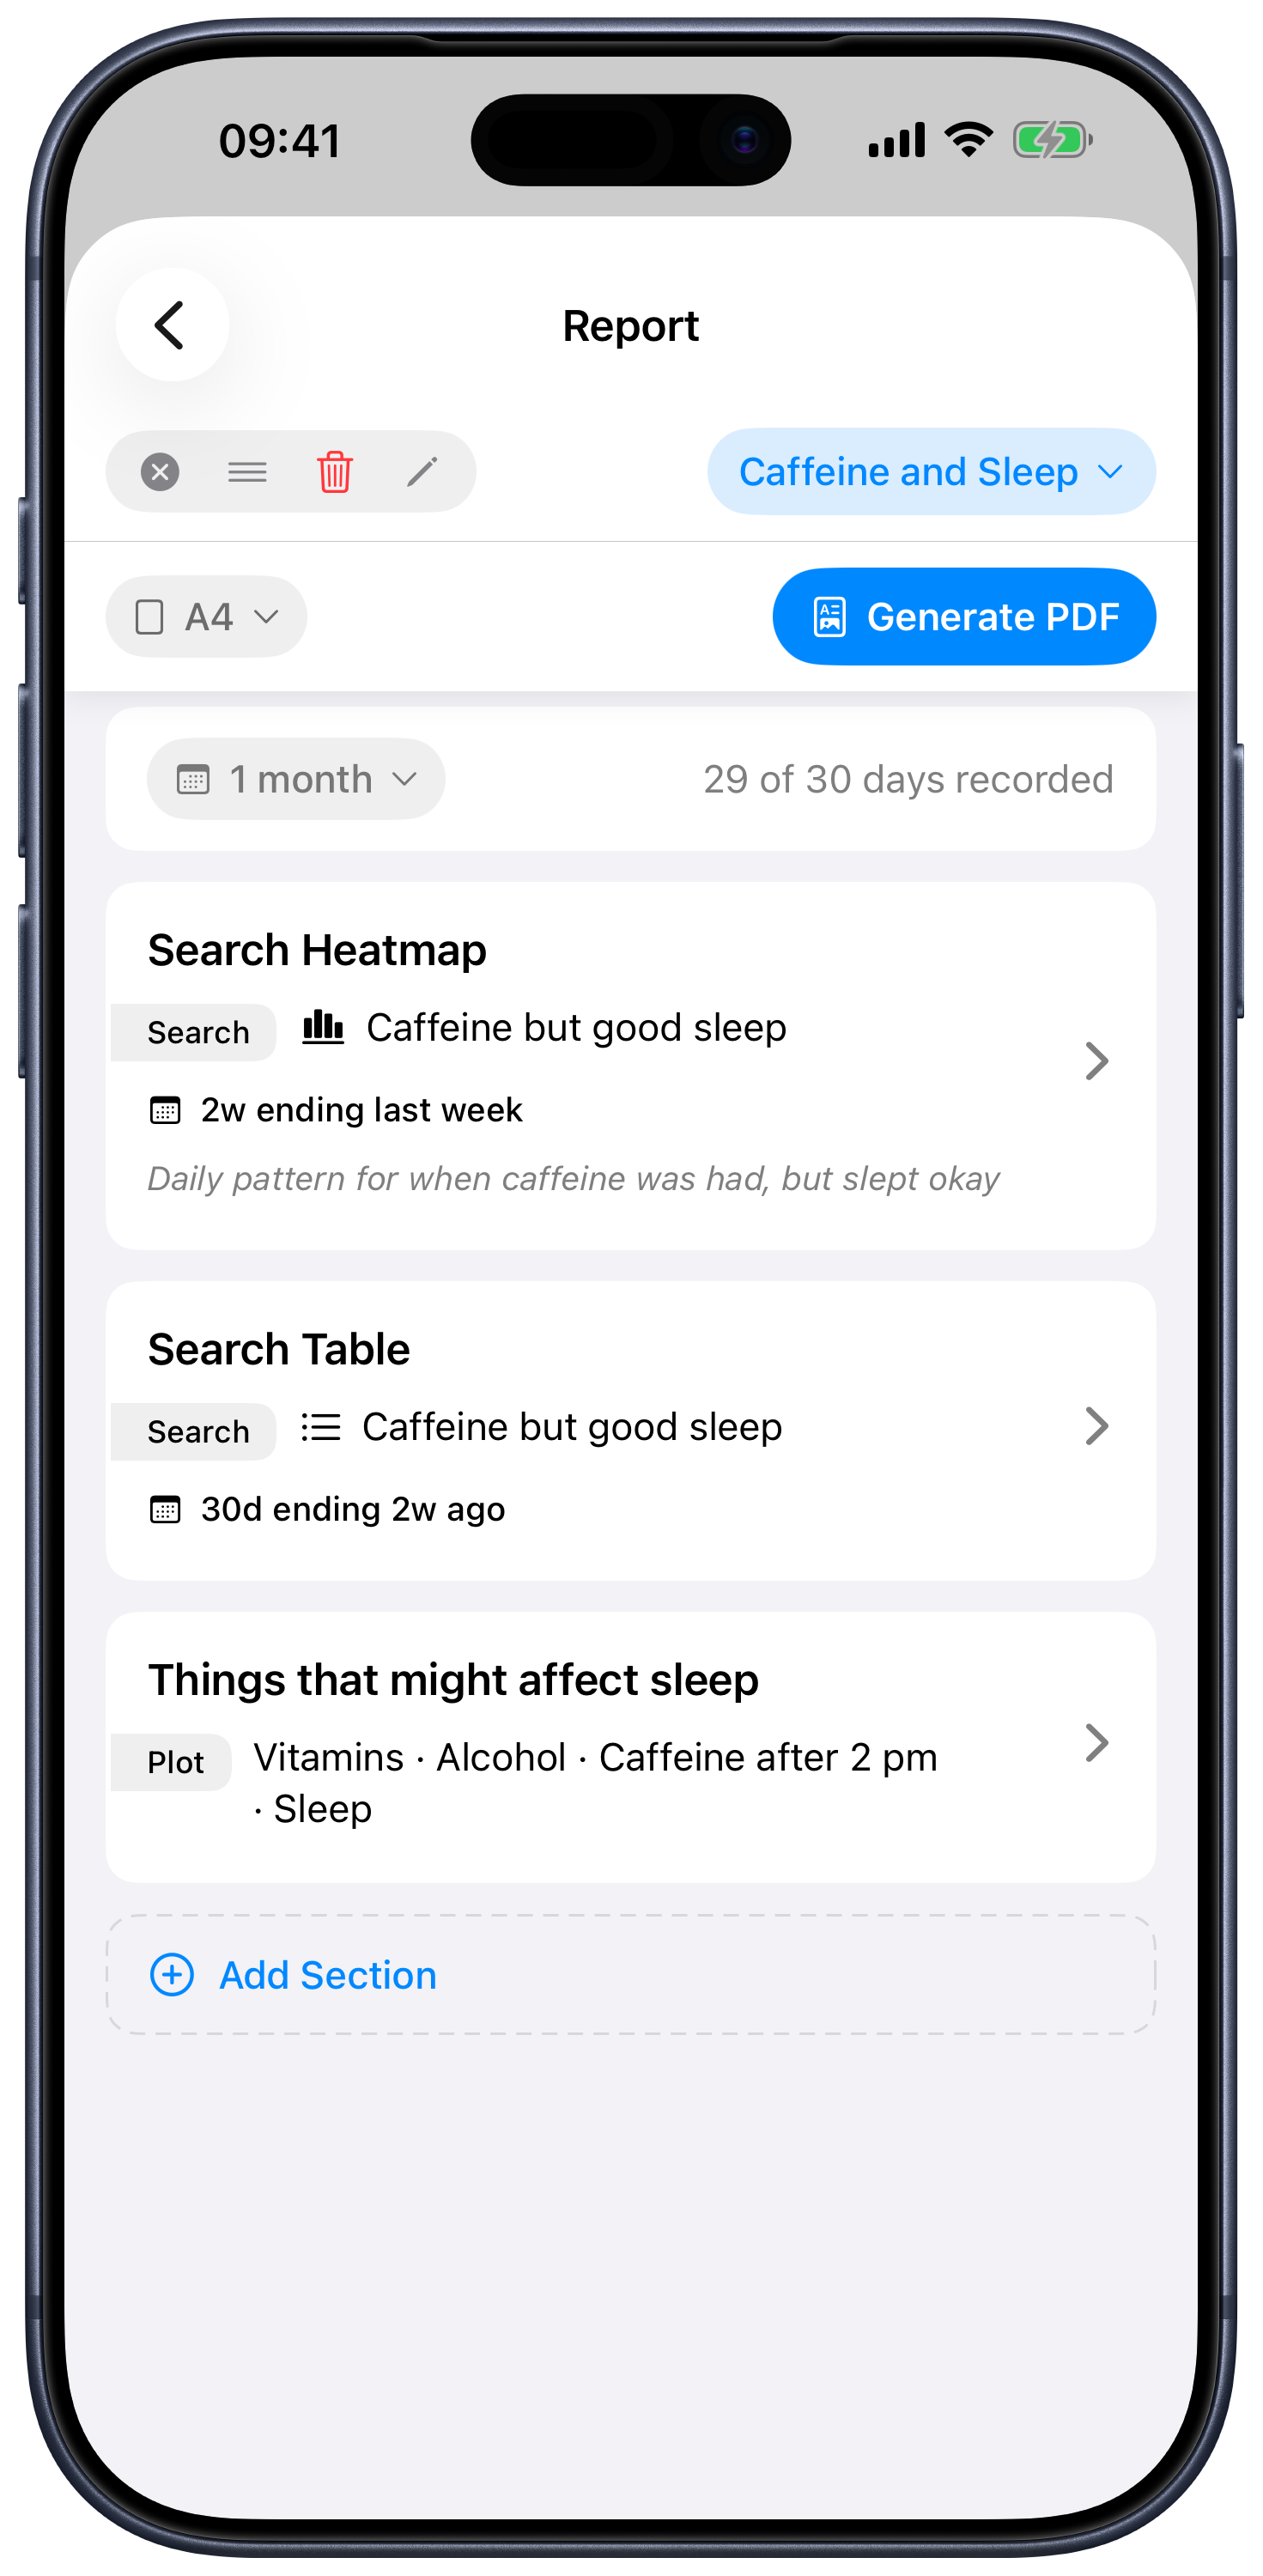
The shape of a report
A report is a list of graph cards, top to bottom. When you generate the PDF, each card becomes a section of the document, in the order you arranged them.
Each graph card can be one of two kinds:
- Variable Plot — line or heat-map of one or more of your variables, over the card's time window.
- Saved Search — the results of one of your saved searches, shown either as a results table or a heat map.
You also choose two report-wide settings:
- Range — how far back the report looks by default (7, 14, 30, 90, 180, or 365 days). Individual cards can override this with their own time window — see Per-section time windows below.
- Page size — US Letter or A4.
Adding and configuring graph cards
Tap Add Section at the bottom of the list. A new card appears.
Tap the card to expand it and configure it:
- Pick the graph type (Variable Plot or Saved Search).
- For a Variable Plot, choose one or more variables — tap to add or remove them as chips.
- For a Saved Search, pick the search from the menu, and choose Table or Heat-map for how the results are drawn.
- Optionally give the graph a custom name (the pencil icon) and a caption that appears below the graph in the PDF.
- Optionally set a per-card time window — see below.
Tap the card again to collapse it.
Per-section time windows New in 2.8
By default, every card uses the report-wide range so the whole document covers the same span of time. Sometimes you want one card to look further back than the others — for example, a 12-month heat map of one habit alongside 30-day line plots of everything else.
Open a card and look for the Time Window section:
- The card starts in Using report default mode. Tap it to switch to a custom window.
- A custom window has two rows: Width and Ending.
- Width picks the length of the window: a count plus a unit of Days, Weeks, or Months.
- Ending picks where the window ends:
- Relative Days / Weeks / Months — n days/weeks/months ago. 0 means "ending today."
- Absolute — a specific calendar date. Useful for re-running the same report against a fixed historical period.
- Tap Use report default to drop the override and follow the report-wide range again.
Cards using their own window display a small summary (e.g. 12 weeks ending today) in the collapsed view so you can see at a glance which cards override the default.
Reordering and removing graphs
- Drag a card up or down (touch and hold the card, then move it) to reorder.
- Trash icon on a card deletes that graph from the report.
Generating a PDF
Tap Generate PDF. Correlate builds the document and opens the iOS share sheet — a panel that slides up letting you choose what to do with the file:
- Save to Files to keep it on your iPhone or in iCloud Drive.
- Mail / Messages to send it to someone.
- Print to send it to an AirPrint printer.
- Copy to another app if it's installed.
The filename is automatic, prefixed with the date and time so multiple PDFs sort cleanly. Special characters in your report name are sanitized so the filename is always safe.
Saved reports
You'll often build a layout once and want to regenerate it later. Saved reports remember the whole configuration — graphs, captions, time range, page size — under a name.
The toolbar at the top of the report builder works the same way as saved searches:
- A selector menu to load a saved report or "Save current…" the one you have now.
- An action pill to clear, rename, or save changes to the active report.
- An orange dot appears when the loaded report has been modified but not yet saved.
Saved reports are stored with your data, so they sync to your other devices.
Tips
- Build a few small saved searches first ("days I exercised," "days I felt tired"), then build a single report that lays them out side-by-side as heat maps. Patterns often surface in the visual map that aren't obvious on a single graph.
- A report with one Variable Plot and a 30-day range is a quick way to capture a "what does this last month look like" snapshot to share with a clinician.
- Add your first and last name in the reports' saved name. That becomes a title and appears on the first page of the PDF, so the clinician knows whose data they're looking at.
- Remember that the plots are always rescaled between 0% (variable range min) and 100% (variable range max). It's percent, not necessarily the value you set! This can be confusing, but it also lets you plot multiple variables together without worrying about the scale. These plots intend to show trend and compare across units.