Recording Your Day
When you open Correlate, you land on today's date with your full list of variables ready to update.
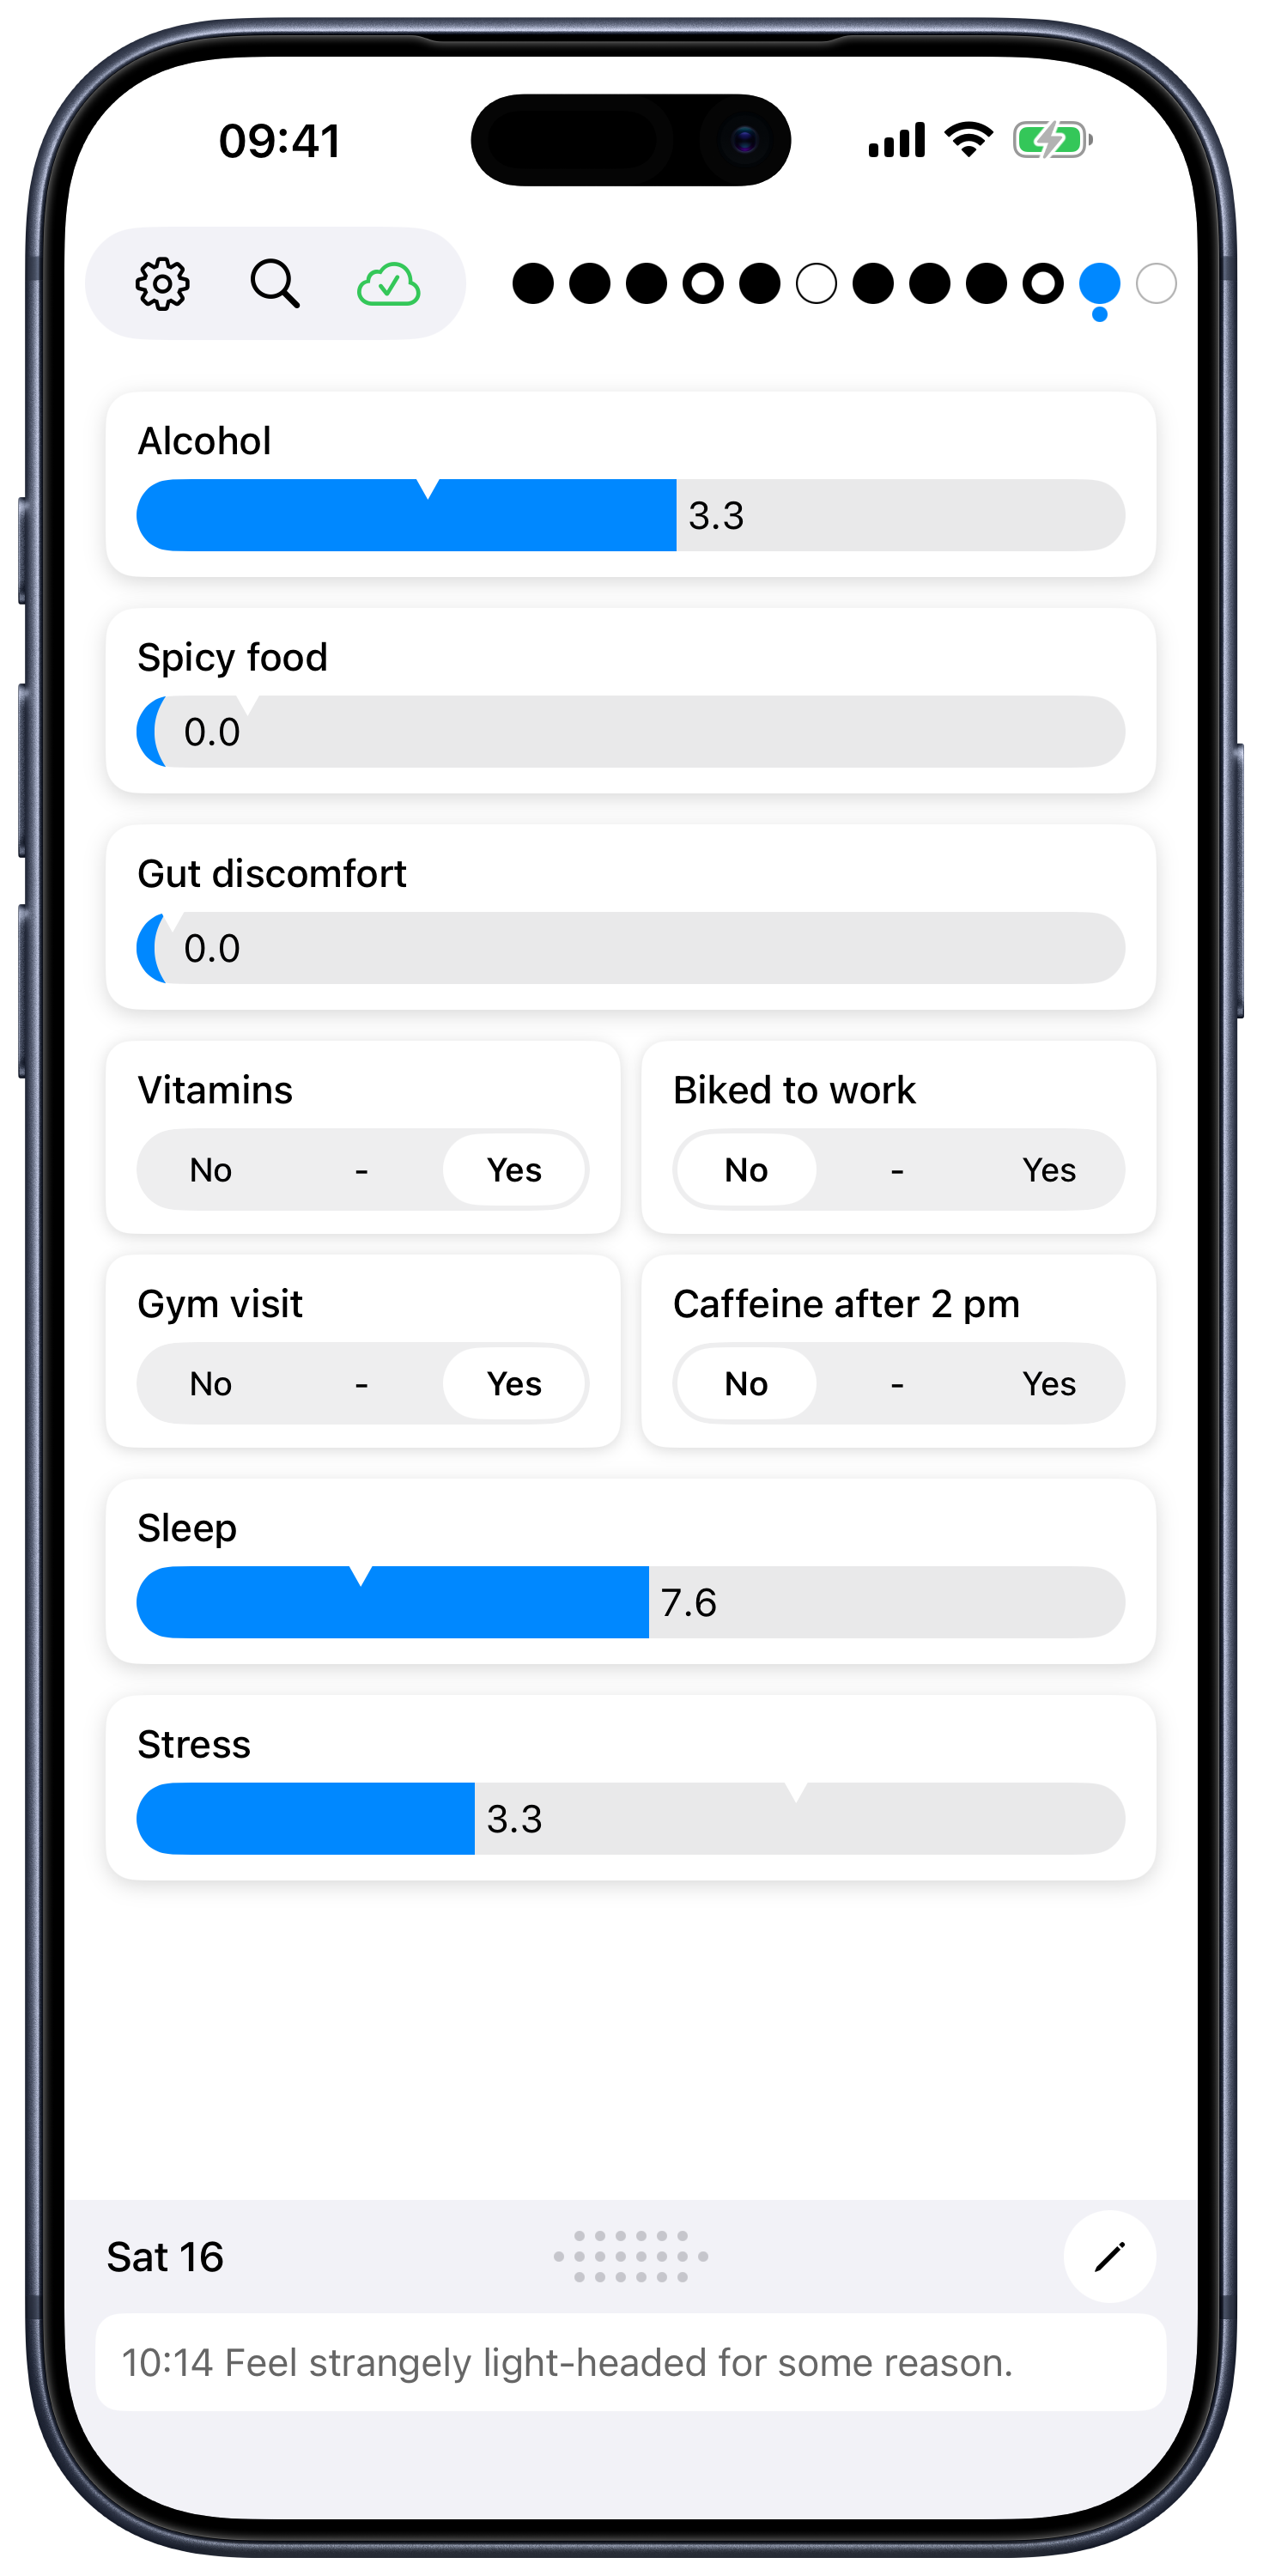
Variable layout
- Number variables (sliders) each get their own row.
- Boolean variables (toggles) are compact: pairs of booleans share a single row to keep the list short and scannable. If you have an odd number of booleans, the last one gets its own row.
The order is whatever order you set in Settings. Adjacent booleans in your list will share a row, so keep that in mind when you arrange them.
Toggles
Tap a Boolean variable to flip it on or off. Tap again to flip it back. There is no save button — your change is recorded immediately.
Sliders
Sliders look like a horizontal bar with a colored fill, and a small notch showing your last value.
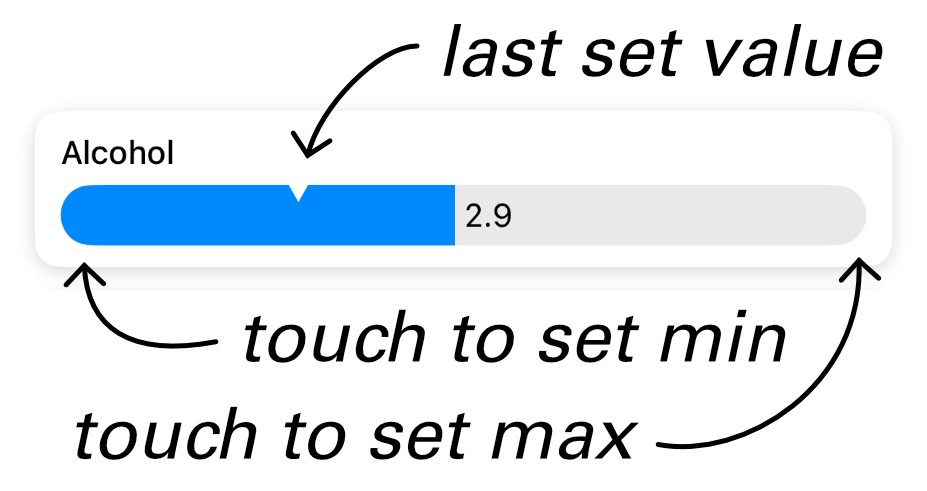
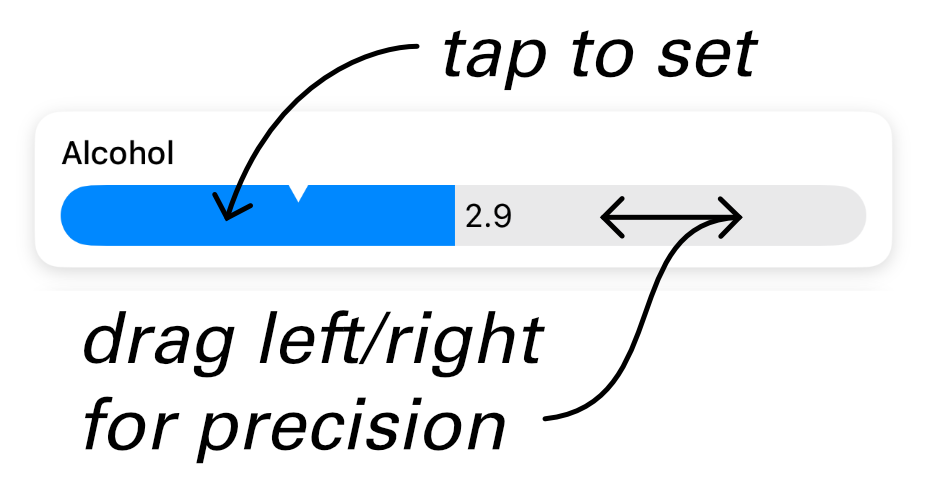
- Tap anywhere on the slider to set it to that value.
- Drag your finger left or right to fine-tune. Drag is dampened — small movements give small changes — so it's easier to be precise.
- Tap the far left or far right to snap exactly to the minimum or maximum.
The slider is continuous while you're touching it, then snaps to the nearest step at the variable's precision when you lift your finger. So if a variable's precision is "1 decimal," dragging through 7.42 → 7.43 will display continuously, but on release it lands on 7.4 (and that's the value that's stored).
Sliders provide quiet haptic feedback while you tap and drag, so you can feel each tick.
The days bar
Across the top of the screen is a row of small dots — one for each recent day.
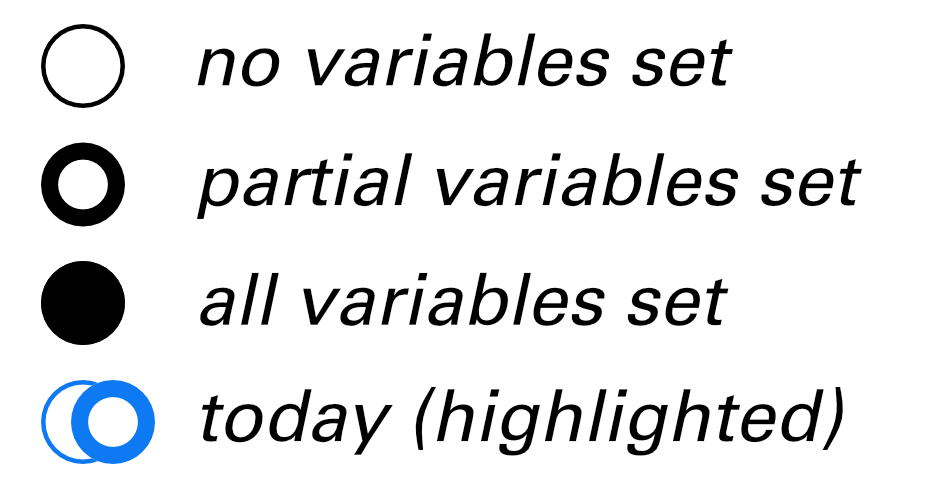
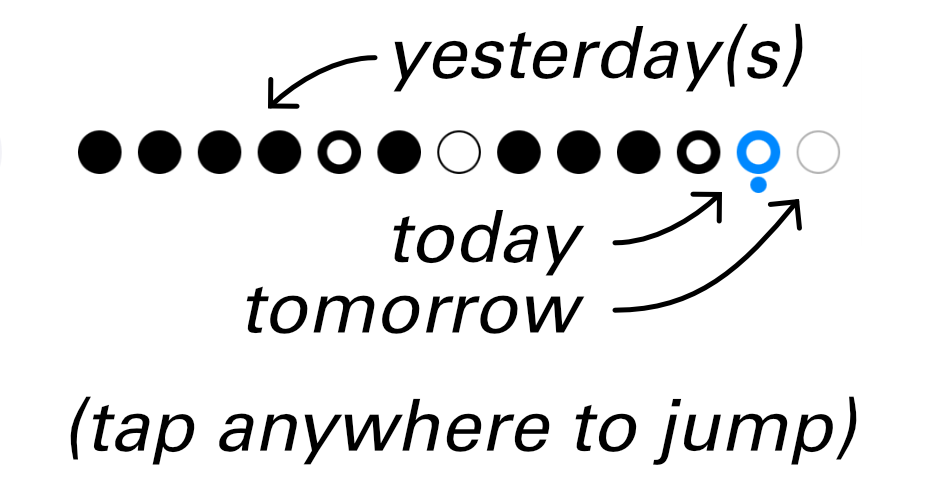
Each dot has three states:
- Empty — you haven't set any variables on that day.
- Half-filled — some variables are set.
- Filled — all variables are set.
Today is highlighted in blue, with a small marker beneath it. Tomorrow appears as a faint gray dot to its right.
Tap any dot to jump straight to that day.
Navigating between days
Four ways to move between days:
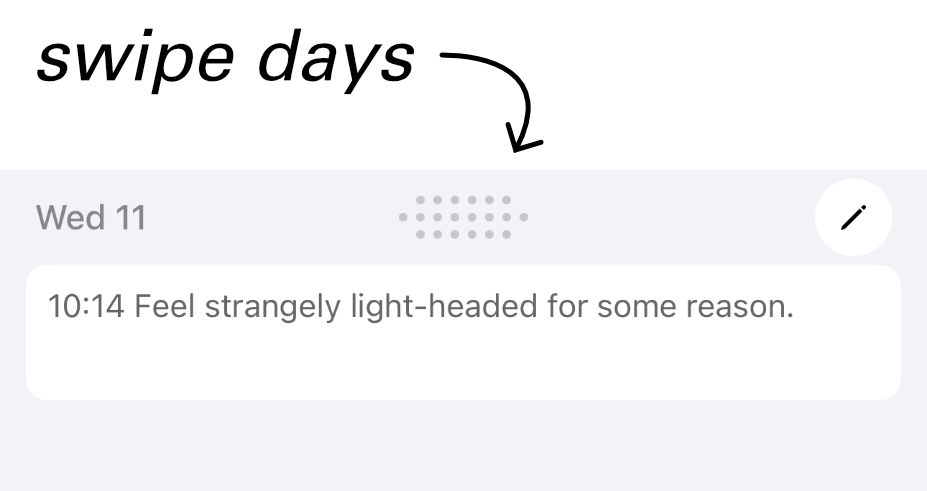
- Swipe left on the note area to go to the next day.
- Swipe right on the note area to go to the previous day.
- Tap any dot in the days bar to jump to a recent day.
- Long-press the days bar to open a calendar and jump to any date.
You can edit any previous day's variables or notes — just navigate to that day and make your changes. Future days exist too (in case you want to record something planned), but most of the time you'll be on today.
Historical edit protection New in 2.8
It's easy to leave the app on yesterday's screen, come back hours later, and accidentally change an old value. Historical edit protection guards against that.
When it's on (the default), the first time you try to change a variable or note on any day before today, Correlate asks for confirmation:
- Cancel — leave the value as it was.
- Change This Once — apply this one edit; the next historical edit prompts again.
- Allow 5 Minutes — unlock historical edits for five minutes, useful when you have a stack of older days to fill in. A red countdown in Settings → Privacy shows the time remaining, and a tap on it cancels the unlock.
Turn the feature off in Settings → Privacy → Historical edit protection if you'd rather not be prompted at all.
Values reset each day
When a new day begins, every variable returns to its unset state. Yesterday's values do not carry forward — Correlate is recording snapshots of each day, not a running state.
Plotting and resetting in bulk
To plot one or more variables, or to reset their values, long-press any variable card on the main screen. After about a second, you'll enter selection mode and a colored toolbar slides in at the top of the screen.

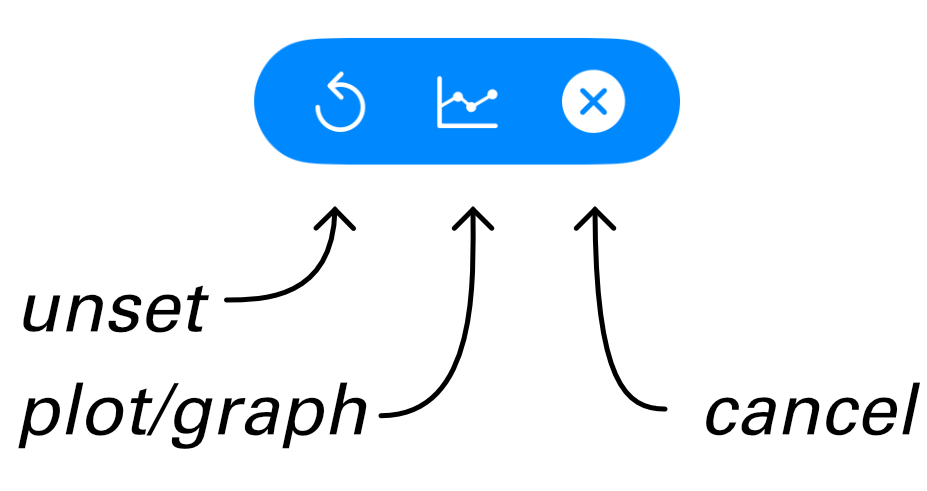
While in selection mode, tap any other variables you want to add to the selection.
The toolbar offers three actions:
- Reset (circular arrow) — clears the selected variables back to "unset" for the current day.
- Plot (chart icon) — opens a graph for the selected variables.
- Cancel (×) — leaves selection mode without changing anything.
What gets plotted
| Variables selected | View shown |
|---|---|
| 1 | Heat-map calendar — a year of intensity at a glance |
| 2 or more | Line graph — the variables plotted together over time |


Exploring a plot Updated in 2.8
Once a line graph is open, two compact controls sit just above the chart:
- Duration — how wide a time window the chart shows. Tap to pick a preset (7, 14, 30, 90 days, etc.) or use the +/- buttons to customize the window width.
- Ending — where that window ends. Tap to pick a relative offset (7, 14, or 30 days), or an absolute date. The blue dot brings you back to today.
You can also drag the chart horizontally to slide the window earlier or later in time. The duration stays the same; only the ending shifts.
For more elaborate visualizations and exporting, see Reports.